Access and visualize food recall data from the Food and Drug Administration
Source:vignettes/foodRecall.Rmd
foodRecall.RmdfoodRecall is an R package that facilitates accessing and visualizing data from the openFDA API. This document provides descriptions and examples of the functions included in the package and some information explaining the process to complete this project for STAT 585 - Data Technologies for Statistical Analysis at Iowa State University.
Disclaimer: This product uses the openFDA API, but is not endorsed or certified by the Food and Drug Administration (FDA).
Background and Motivation
This project is motivated by the need for more visualization in healthcare, especially for food-related problems. In many instances, people are informed about food recalls and foodborne illnesses in the news, but are unclear of the extent or severity of such occurrences. Likewise, many healthcare and government organizations maintain extensive records of food recalls and related illness, but there are few software packages available for visualizing these types of data. The foodRecall package strives to make analysis of food recall data more accessible and easier to read and use so that scientists and civilians alike are able to make informed choices regarding food safety and security.
Our R package contains code, data, and documentation about the foodborne outbreaks that happened in the United States in the recent decade. The package helps highlight the city, state, country, and time the outbreak occurred.
Set up
Before running any of the package functions, the user will need an API key. To get the API key, go to the openFDA API website. The API key is free to obtain and only requires and email address. Do not share your API key with anyone.
library(foodRecall)

api_key <- "YOUR API KEY"
Functions and Applications
# Get food recall locations

location <- foodRecall::recall_location(api_key = api_key,
                                        city = "Milwaukee",
                                        state = "Wisconsin",
                                        recalling_firm = "Garden-Fresh Foods")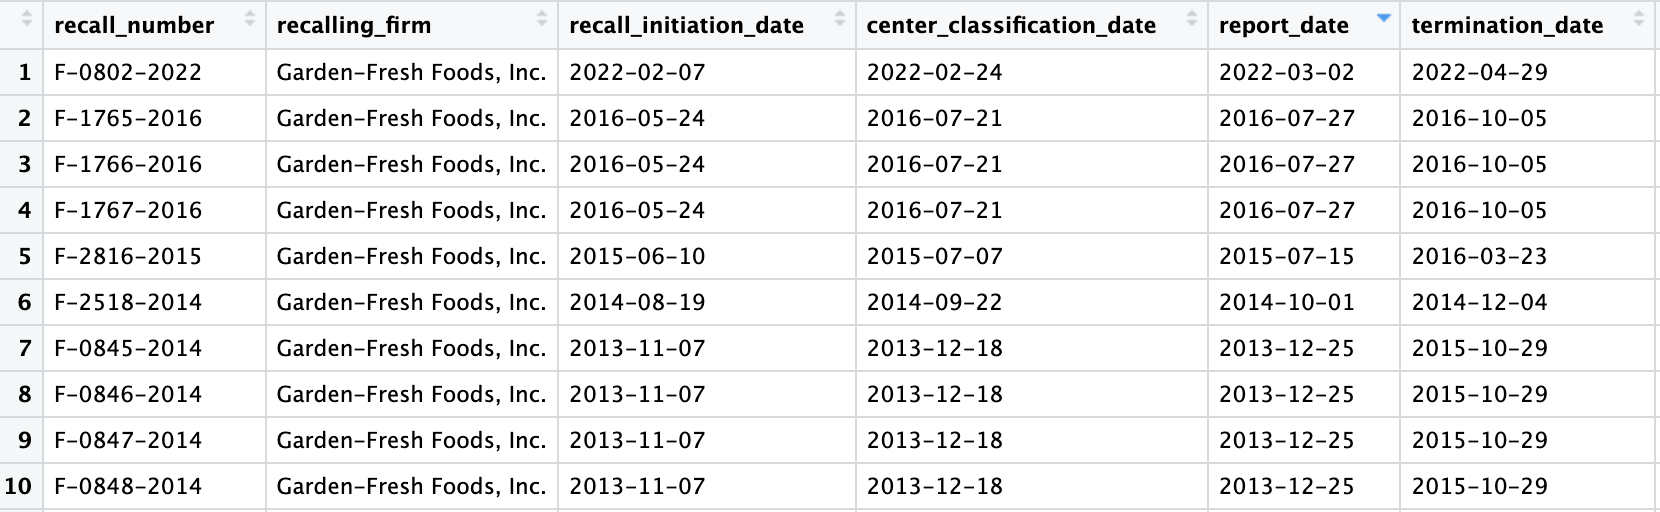
An example of the tabular output of recalls from Garden Fresh Foods in Milwaukee using the recall_location function
The recall_location function provides a list of all food
recalls for a designated city. Additional functionality includes the
ability to specify inputs such as the firm responsible for each recall,
the current status of the recall, and the distribution pattern (which
states/regions the recall has affected). One must specify their API key
as the first input. For example, the above code will display all recalls
over time for the city of Milwaukee from the company Garden-Fresh Foods,
which has experienced many recalls, including those that are class 1
over time due to contamination of produce. The tabular output, as shown
in the figure above, includes information such as the reason for recall,
description of the product, quantities of recalled products, and dates
of recall. One can specify any of these columns as an input to the
function if they desire to look more specifically at a particular group
of recalls. This tabular format places all FDA recall variables into a
tidy, easy-to-read format.
# Map food recall locations

map <- foodRecall::map_recall(data = location)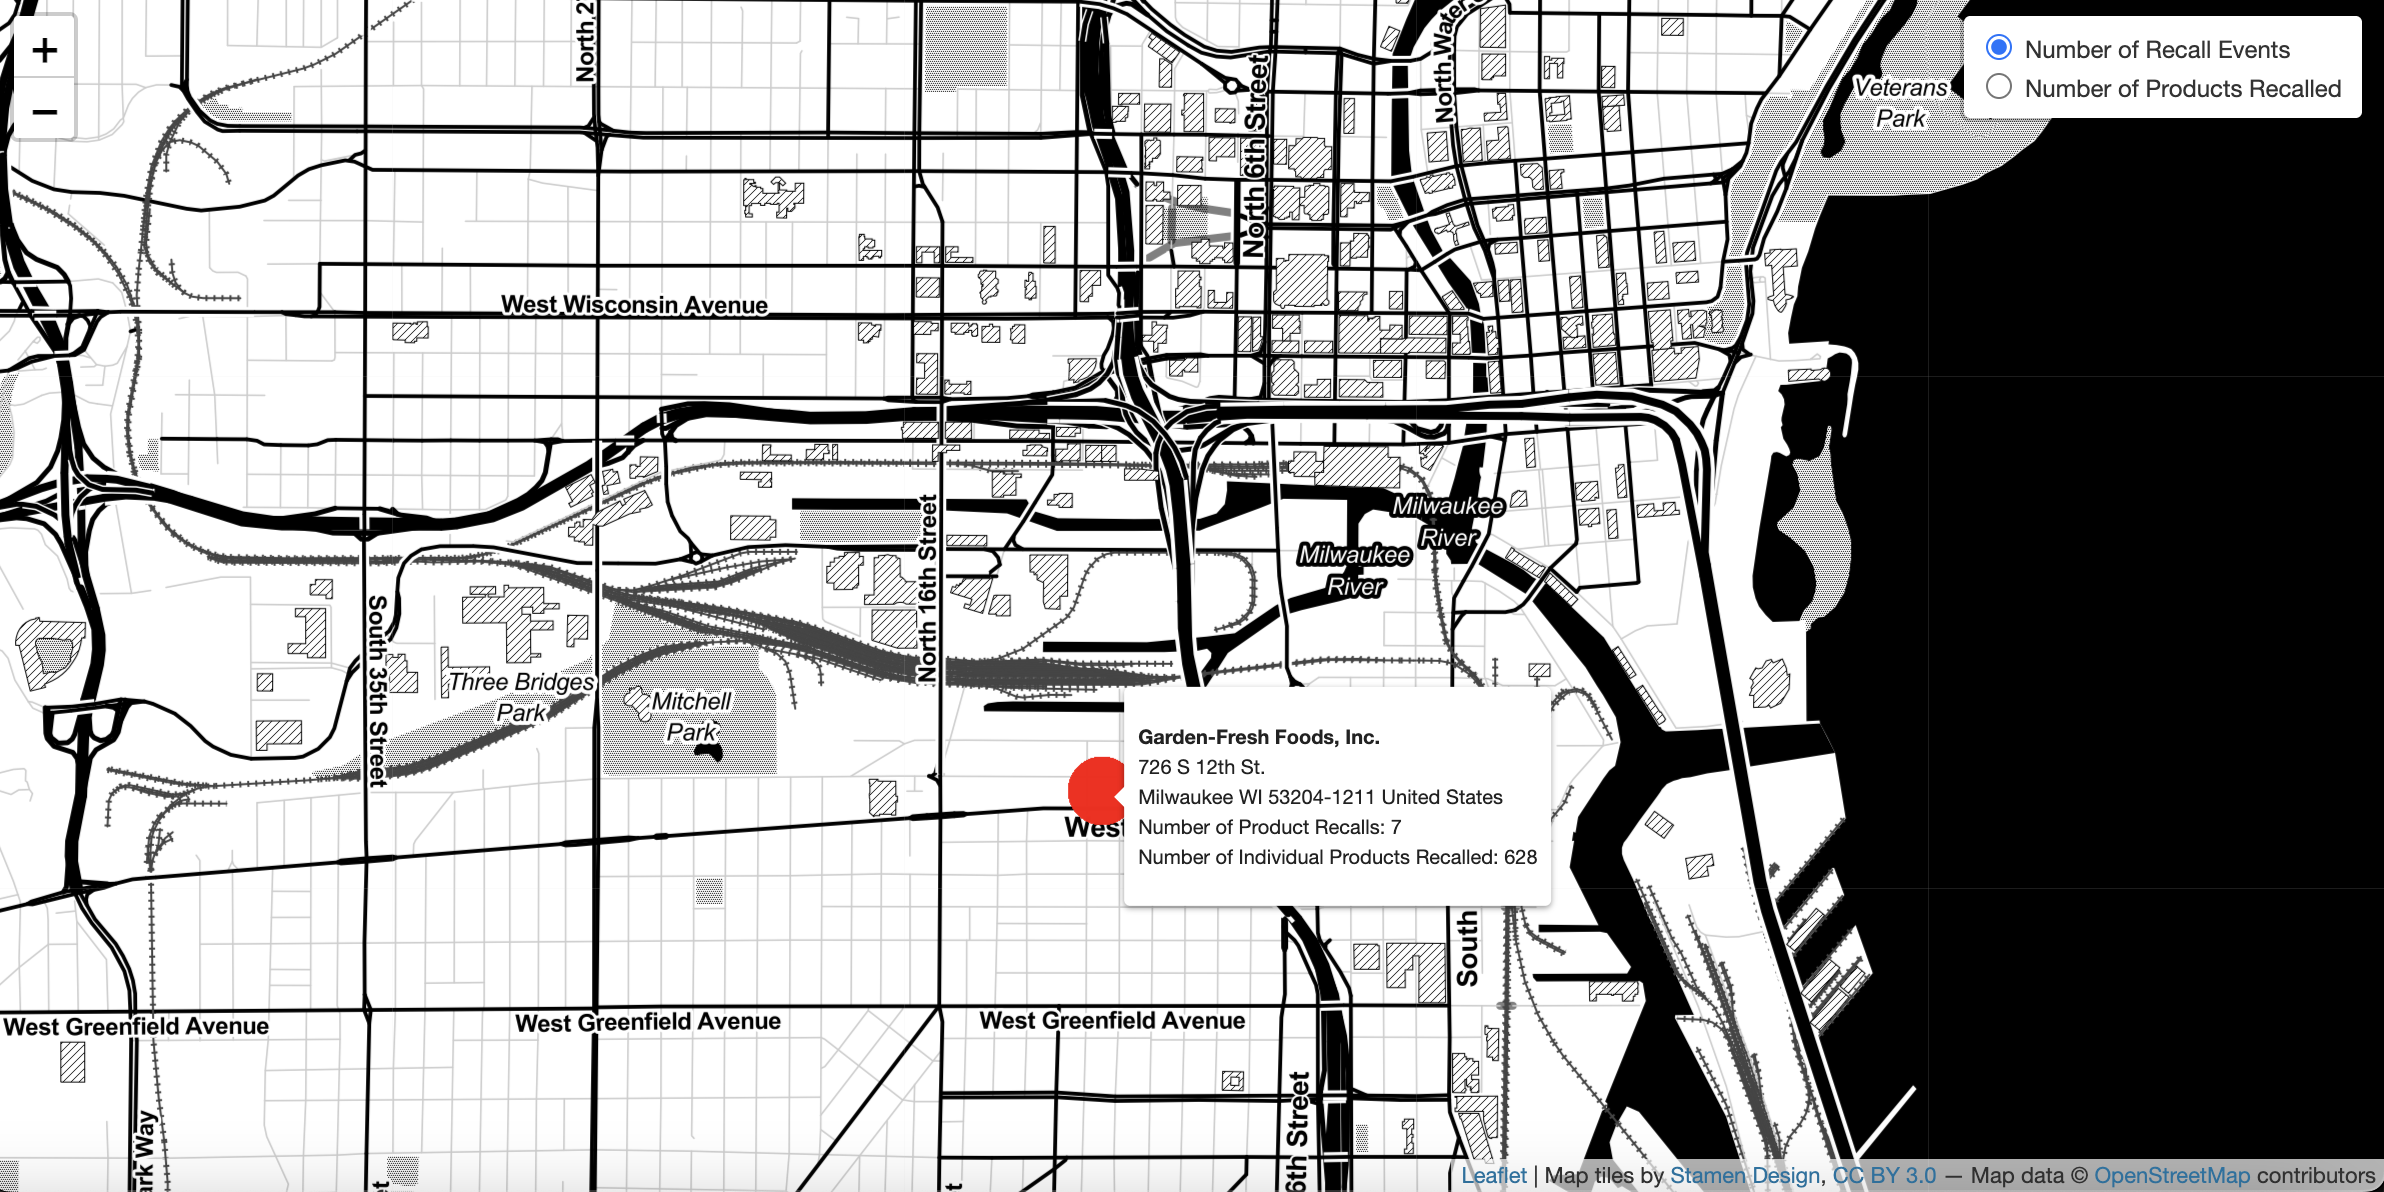
Map of Food Recalls in Milwaukee using map_recall function
This package provides an interactive map food recalls based on the saved location from the recall_location function. All of the inputs from the recall_location function are displayed, including the firm of interest, product type, and dates of recalls. The locations of firms involved with recalled products are marked on the map with red circles. Locations on the map can be interactively sorted either by the number of recall events at a given firm, or by the total number of products recalled. Darker red circles are associated with a greater number of recall incidents. The zoom feature in the upper-left corner enables one to expand or narrow one’s field of view.
# Working with food recall dates

date <- foodRecall::recall_date(api_key = api_key,
                                recall_initiation_date = "2023-01-01",
                                status = "Ongoing")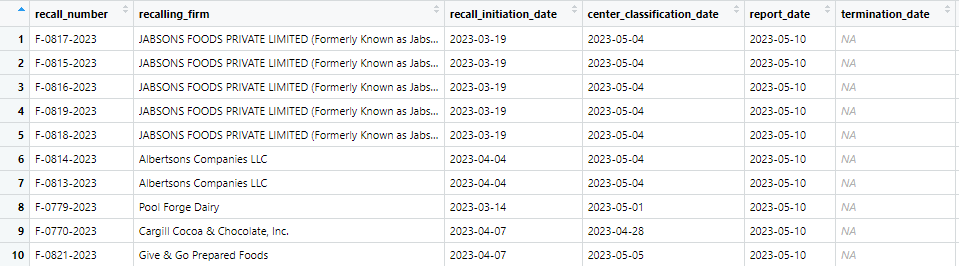
Example of output from recall_date function
This package allows a user to input a date or range of dates in order to see what types of food recalls occurred within a certain interval of time. For instance, the above example displays all food recalls starting on February 1st, 2022 and ending on May 7th, 2023. Input options include the date of recall initiation, the current status of the recall, and the distribution pattern of the recall. This makes it easy and efficient to see the status of any current or past recalls that might have had an impact within a certain range of time. One current limitation, however, is that it does not provide a visually appealing tabular or graphical format that is similar to aforementioned packages. However, it is beneficial for looking up a single recall or time period of interest.
Shiny application
To run this package’s Shiny Application, use the following code:
foodRecall::runExample()This will open a graphical user interface that appears as follows:
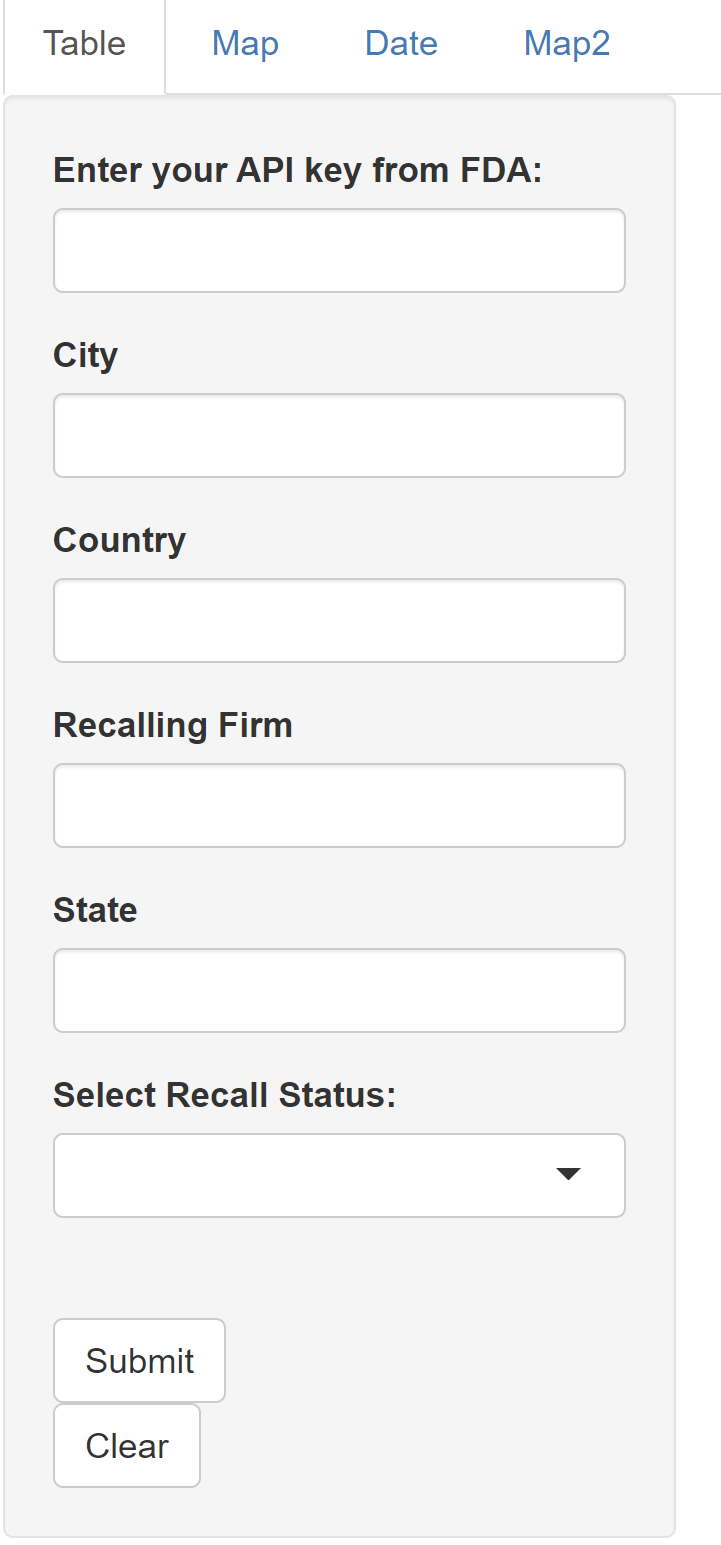
Example of shiny app user interface
Now, if we want to look at recall data with the city specified as Miami, the state as Florida, we end up with the following for the table tab:
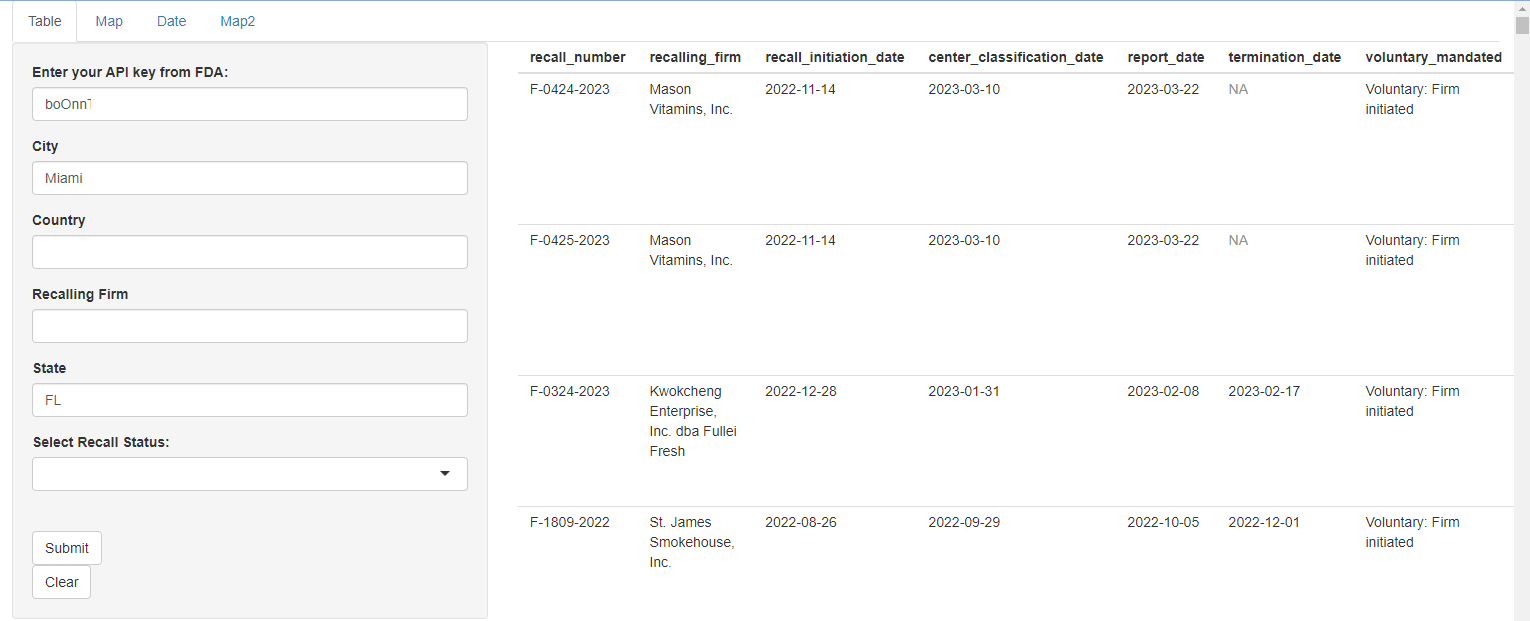
Example of shiny app tabular data for Miami, Florida
Output appears as follows for the “Map” tab:
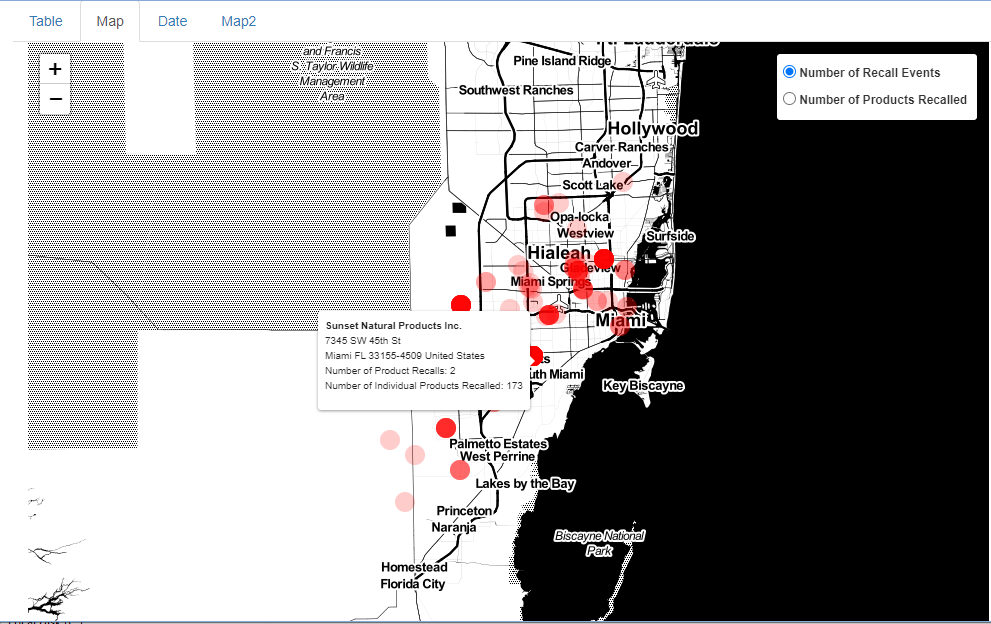
Map of Miami, Florida and all its food recalls in the FDA database*
The “Date” tab allows one to input a recall initiation date and firm of choice, along with a product description and status of recalls, if that is desired. Below is an example of ongoing recalls since January 1st, 2023.
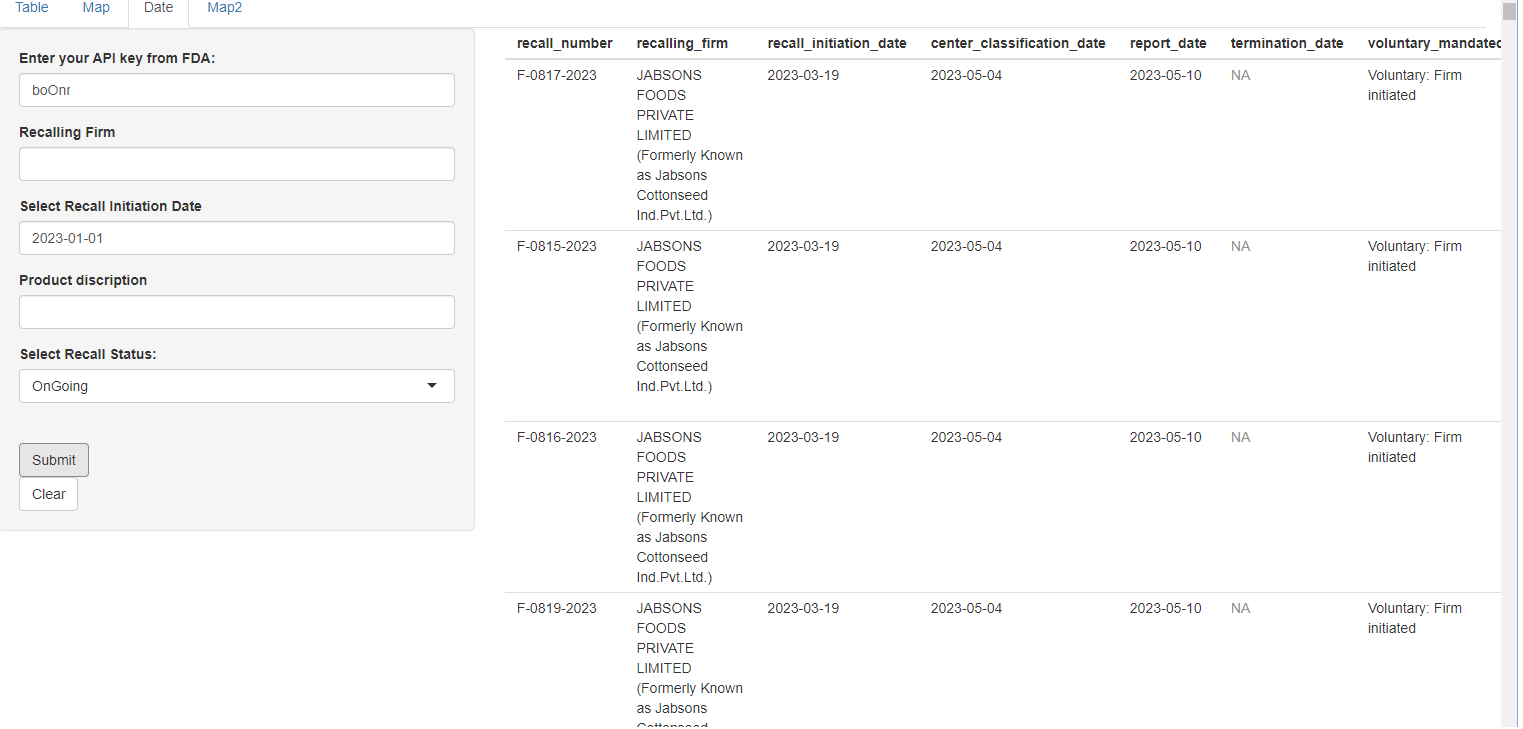
Current Ongoing Recalls initiating on January 1st, 2023
To visualize the ongoing recalls since January 1st, 2023 on a map, select the “Map2” tab.
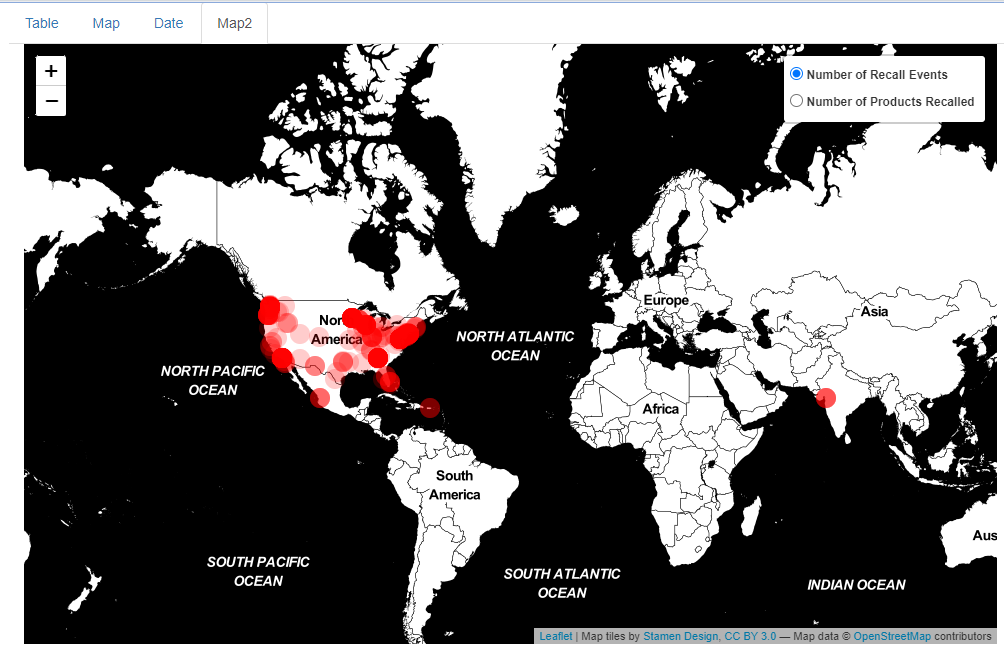
Map of Ongoing Recalls initiating on January 1st, 2023
The shiny app provides an easy, efficient method for working with FDA data without significant knowledge of R programming. Anyone who has some basic knowledge of user interfaces and web applications will be able to use this application to track food recalls across the United States.
Limitations
Currently, our package only provides information relating to food recalls. In the future, it would be beneficial to expand this package to include foodborne illness statistics from across the globe, due to the fact that many food recalls are initiated by outbreaks of foodborne diseases. In this manner, it would be easy and efficient to compare illness rates from foodborne diseases in different countries. Furthermore, it would be possible to track, model, and predict the spread of foodborne illnesses as they move from nation to nation, which could lead to early government intervention in containing the spread of various illnesses. One complication with this, however, is that a global database would require the combination and analysis of a large number of datasets. Due to this, and the fact that many nations do not consistently track disease statistics, this would be quite ambitious.
Future Work
In the future, it would be optimal to try and combine this package with other information, such as agricultural data from the United States Department of Agriculture (USDA). One of the original ideas for our project dealt with analyzing crop progress data from the USDA’s National Agricultural Statistics Service (NASS). This service provides information on statistics such as crop planting, germination, harvest, etc. Many foodborne illness outbreaks initiate from bacteria, fungi, or insects that emerge at certain crop development stages. If food-borne illness and crop progress statistics could be combined and analyzed together with the same package, it would be much easier for organizations such as the FDA to predict the severity of food-borne illnesses and to develop measures for their prevention. It could also be a useful tool for farmers and others whose work entails a key role in the prevention of such diseases, such as with the application of herbicides and other agricultural chemicals. Additional agricultural statistics from livestock facilities could be combined with these data sets in order to provide a more complete picture of how livestock yields over time have impacted rates of foodborne illnesses such as salmonella.
Another possibility for a future improvement to this package would be the addition of a feature that enables users to track areas that have featured the origin of the most food-borne illnesses. If high-risk areas can be identified by simply keeping a count of the number of cases of a certain disease over time, it will be easy to pinpoint where many diseases are originating and how to prevent the spread of such diseases. Essentially, expansions to this package could enable governmental and other organizations to work together on joint projects relating to food safety.
Finally, additional functionality could be created that allows for the combination of food-borne illness data with other disease related data. In this sense, it could be useful to healthcare professionals who are treating such illnesses and may be more interested in treatment options rather than origin of disease. Hence, it could be useful to develop functionality with regards to symptoms and symptom severity as it relates to diseases of interest.